Dynamic images and dynamic text (infographics or "illustrations") can be created in Illustrate and then added to presentations or publications. The dynamic illustrations that were created in Illustrate can be driven by the values selected from slicers. This includes changing color, size, rotation, volume, showing or hiding, and, in the case of dynamic text, changing value.
Tip: You can use the Open in Illustrate option on the right-click context menu to open images or text fields that were created in Present Pro, in Illustrate. Once open, you can manage their dynamic properties there and save them individually.
This topic describes how you can use dynamic output from Illustrate in presentations. Other dynamic options exist that allow you to replace variables with information about your presentation or pull data from matrix grids into text fields, and so on.
- Click here for more about dynamic assets
Configure dynamic assets
Before you begin
This topic is about integrating pre-existing dynamic infographics and text created in Illustrate into your presentation. It assumes that these Illustrate files have been created in advance and made available for you to add to your presentation from the Content panel.
- Click here for more information about dynamic images in Illustrate
- Click here for more information about dynamic text in Illustrate
Step 1: Add illustrations and slicers
From the Content panel:
- Locate your Illustrate dynamic infographic or dynamic text item and drag it onto the canvas.
- Add a slicer to your canvas that you want to affect your dynamic asset.
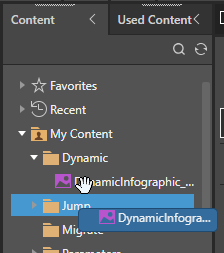
Note: Any Illustrate content item has an Illustrate icon in this tree.
For example, if you are adding an infographic that changes color based on sales, you might want to add a slicer that filters the sales by promotion category so that you can see the effect of changing that category on the color of this graphic.
Step 2: Create interactions
The dynamic asset and slicer are not connected by an interaction automatically, even if the Auto Interact option is enabled. You need to create the interaction to make your selection from the slicer enable a response from the dynamic asset.
From the Presentation ribbon:
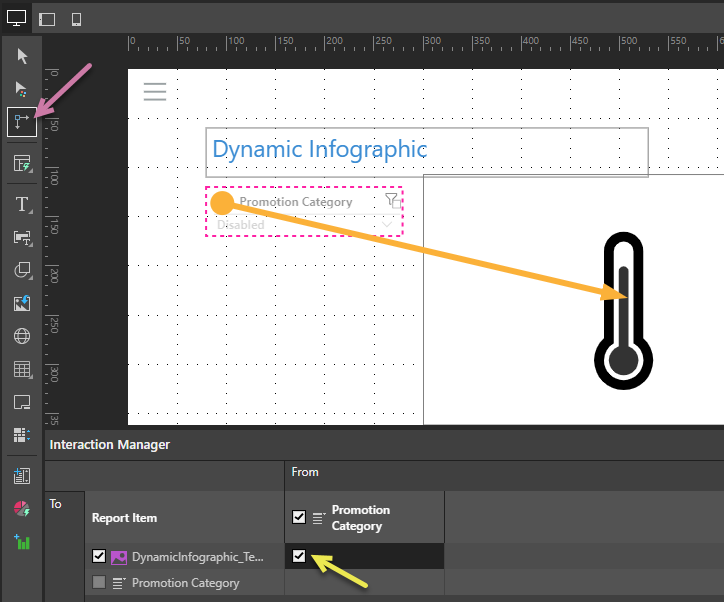
- Open Interaction Manager and select the checkbox at the intersection between the slicer and the dynamic asset (see yellow arrow below).
- Select the Interaction Picker and click and drag from the slicer to its dynamic asset to create an interaction.
- Click here for more information about interactions
The following example shows an interaction between a promotion category slicer and a dynamic asset created in Illustrate. The interaction was created using the Interaction Picker (purple arrow), and is represented in the Interaction Manager by the selected checkbox between the two content items (yellow arrow):
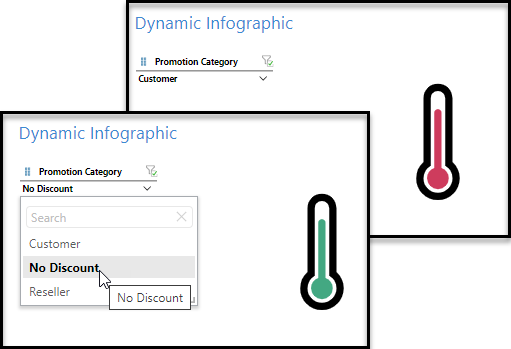
Step 3: Test at runtime
You should always check that your changes have the effect you intended. Open the presentation at runtime by clicking Run or F2 to check that the dynamic asset responds as expected. For example, updating the value in the Promotion Category slicer filters the sales level, which changes the color of the thermometer infographic: